


How Z.ai Used GLM to Build Its Own Inference Infrastructure in 13 Days
On September 17, 2026, Z.ai published a technical account of something that had not been done before at scale: using a language model — GLM-5.3 — to build and optimize the inference infrastructure that a newer version of the same model, GLM-5.3-Flash, now runs on in production. The cluster involved more than 100,000 Chinese-made AI accelerators. The timeline was 13 days from first successful run to production readiness. The throughput gain was exactly 3.22x the initial W8A8 baseline. Z.ai’s own framing of the moment: “our successors are the AI systems we are creating ourselves.”
That headline tends to swamp the more transferable insight buried in the post. Strip away the recursive self-improvement framing, and what remains is a precise engineering argument about why AI agents fail at systems work and what you have to build to make them succeed.
The Problem: Why Standard Coding Agents Stall on Infrastructure
The challenge Z.ai faced was not capability — GLM-5.3 could write correct code. The challenge was feedback. In application development, an agent that breaks something usually learns about it quickly: a test fails, a build errors out, a type system complains. The feedback is local, cheap, and objectively verifiable.
Inference infrastructure is different. End-to-end metrics like throughput and time-to-first-token tell you that something got worse, but they cannot tell you whether the regression lives in a kernel, a scheduling decision, a communication path, or a memory allocation. An agent that only receives aggregate metrics cannot form useful hypotheses about complex systems. It will optimize at the wrong layer, or introduce changes that look neutral in microbenchmarks and regress badly under real workload.
Z.ai’s account names this problem directly. Their solution — which they call a dense feedback system — is the transferable lesson from the project.
The 13-Day Trajectory, Day by Day
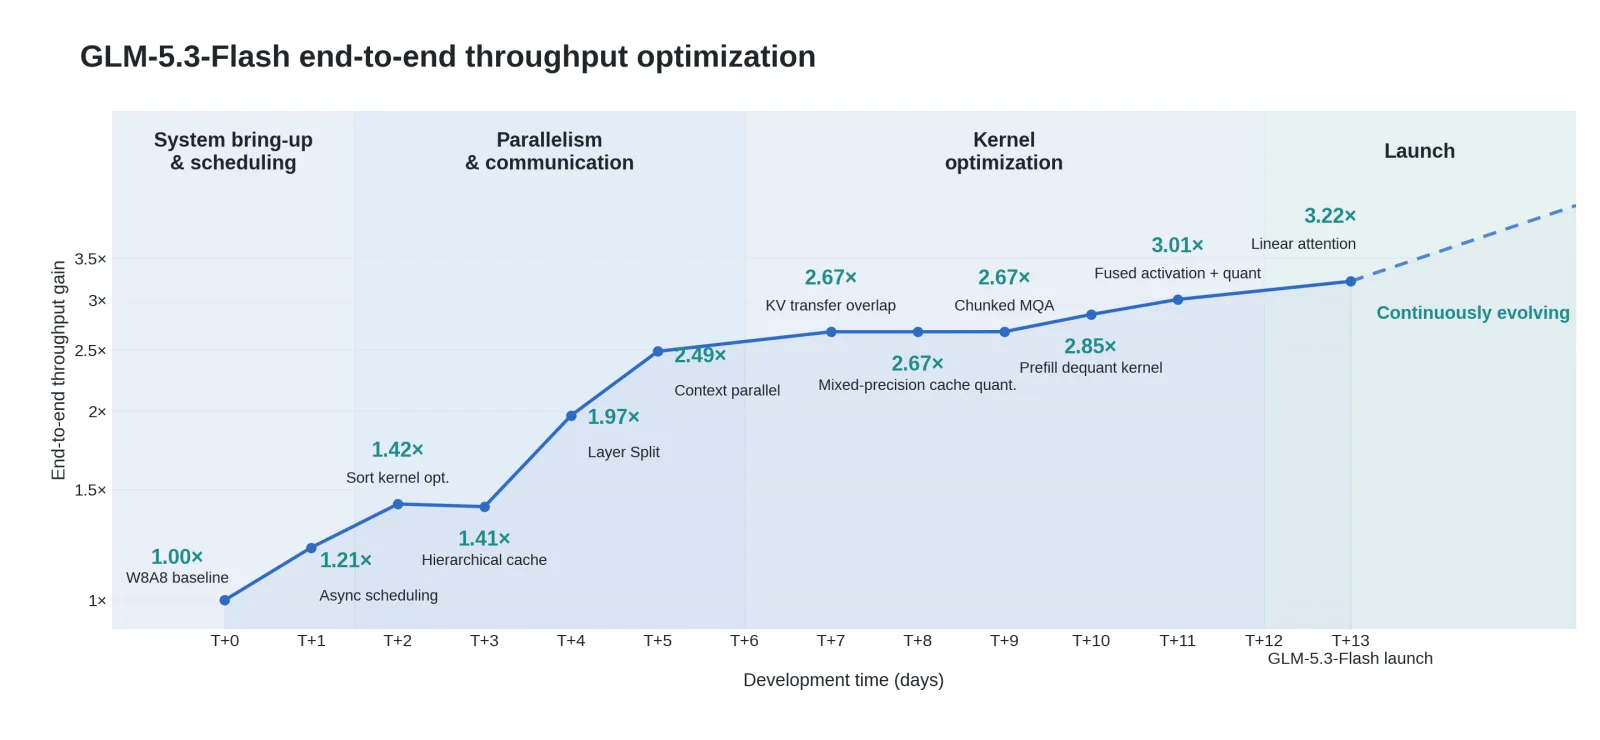
Z.ai published the full optimization curve. It is more useful than the summary number because it shows where the gains actually came from, and where they did not.
| Day | Cumulative Gain | Optimization | Phase |
|---|---|---|---|
| T+0 | 1.00x | W8A8 baseline | System bring-up |
| T+1 | 1.21x | Async scheduling | System bring-up |
| T+2 | 1.42x | Sort kernel optimization | Parallelism |
| T+3 | 1.41x | Hierarchical cache | Parallelism |
| T+4 | 1.97x | Layer Split | Parallelism |
| T+5 | 2.49x | Context parallel | Parallelism |
| T+7 | 2.67x | KV transfer overlap | Kernel optimization |
| T+8 | 2.67x | Mixed-precision cache quantization | Kernel optimization |
| T+9 | 2.67x | Chunked MQA | Kernel optimization |
| T+10 | 2.85x | Prefill dequant kernel | Kernel optimization |
| T+11 | 3.01x | Fused activation + quantization | Kernel optimization |
| T+13 | 3.22x | Linear attention | Launch |
Three things stand out that the prose summary does not convey. First, the largest gains came from parallelism, not kernel work. Layer Split and Context parallel together moved the system from 1.41x to 2.49x in two days — more than half the total gain in roughly one-sixth of the timeline. The kernel optimization phase, which takes up most of the article’s technical detail, moved it from 2.49x to 3.01x across six more days.
Second, T+3 went backwards. The Hierarchical cache optimization dropped cumulative gain from 1.42x to 1.41x. Z.ai published this regression rather than smoothing the curve — a small but real credibility signal. The optimization looked sound in isolation; it did not survive real workload.
Third, there is a three-day plateau at 2.67x. T+7, T+8, and T+9 each landed a named optimization and none moved the headline number. Those improvements were likely consumed by other constraints that T+10’s prefill dequant kernel finally broke.
Three Cases Where the Agent Did Real Work
TF32 Precision in the KDA Context Parallelism Path
The agent’s correctness testing framework compared partitioned against unpartitioned execution paths and found a numerical discrepancy. The cause: Triton’s tl.dot defaults to TF32 precision for FP32 inputs. In most contexts this is fine. In the Context Parallelism path, it introduced accumulated error that the test framework caught. The fix was setting input_precision="tf32x3" on both operations. This was subsequently merged upstream into the Flash Linear Attention project as PR #1180. The fix came from a system that could compare execution paths in isolation, not from reading an aggregate log.
The Python GIL and KV Transfer Scheduling
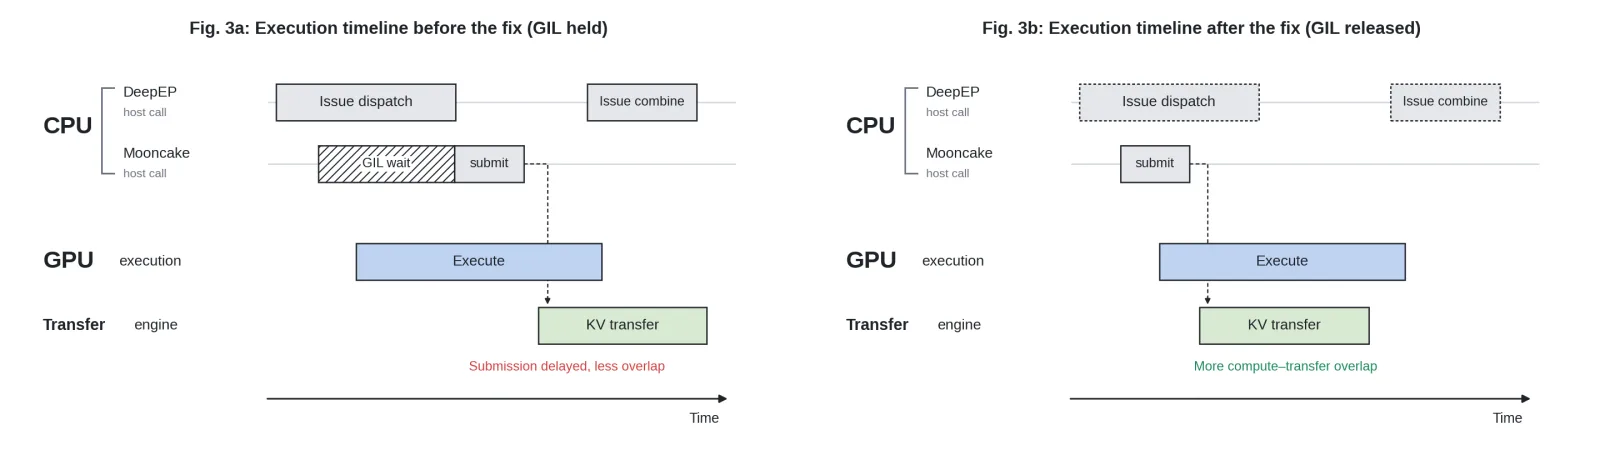
Prefill + KV Transfer latency was more than 20% above the Prefill-only baseline in certain serving scenarios. Execution timeline analysis showed that Python-side KV Transfer scheduling never overlapped with DeepEP dispatch and combine calls, even though the design assumed it would. The root cause: DeepEP v1.2.1’s intranode_dispatch and intranode_combine calls did not release the Python GIL, blocking the Mooncake Transfer thread. Explicitly releasing the GIL during the relevant C++ execution intervals brought the latency gap below 1%.
Kernel Optimization via Distilled Templates
The agent extracted optimization patterns from kernels in SGLang, Flash Linear Attention, and DeepGEMM, distilled them into reusable templates with documented applicability conditions, and applied them to GLM-5.3-Flash’s KDA Decode kernel. The opportunity: tiles were computing redundant FP32 normalization and gating operations separately. Merging those tiles into a single thread block with register-resident shared state eliminated the redundancy and produced a 1.71x speedup on that kernel stage.
What Dense Feedback Actually Means
Z.ai’s term “dense feedback” describes a specific design property: every validation method answers a specific question at a specific cost. Correctness tests answer whether a code path produces the right output — they cost milliseconds and eliminate numerical bugs before they reach the scheduler. Microbenchmarks answer whether a specific operation is faster under specific input conditions — they cost seconds and confirm whether a kernel change holds in isolation. Execution traces answer where time goes across computation and communication. End-to-end load tests answer whether local gains survive realistic serving workloads.
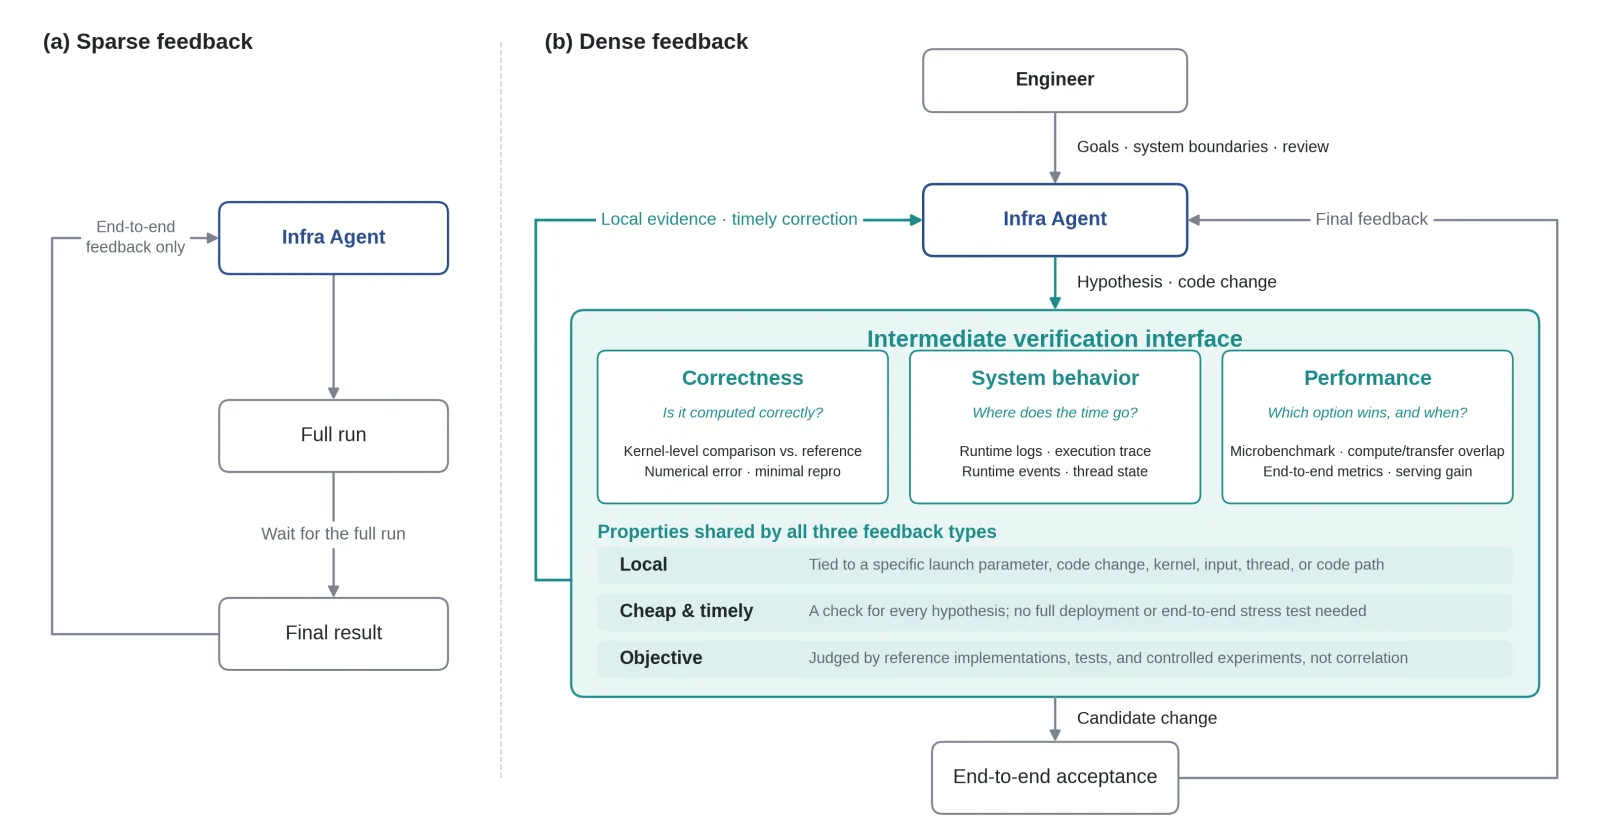
Running expensive tests before cheap ones wastes compute budget and, more importantly, leaves an agent without intermediate signal to form useful hypotheses. The design requires building correctness tests, microbenchmarks, execution traces, and end-to-end tests as separate, purpose-built tools — not relying on aggregate metrics as a proxy for all of them.
On the Recursive Self-Improvement Framing
Z.ai is careful about what it claims. The post states plainly: they have not reached recursive self-improvement. Human engineers set objectives, defined system boundaries, reviewed changes that touched concurrency semantics, and made every production risk decision. The agent proposed diagnoses, generated kernel patches, and edited the stack — work that consumed engineering hours that would otherwise have been required by people, but work that operated within constraints humans defined and outcomes humans verified.
The more precise description is AI-augmented infrastructure engineering running faster than a conventional team could. Whether the agent was the primary reason or the dense feedback environment was the primary reason is a question the post does not resolve — and probably cannot, since the two are not separable in this experiment.
What This Means for Engineering Teams
The feedback environment is a design choice that a team makes before any agent runs. Building correctness tests, execution traces, and per-layer microbenchmarks makes human engineers faster too. The observation that applies across both contexts: agents amplify the quality of the feedback system they operate in, not the other way around.
For teams evaluating AI in infrastructure and systems engineering, the right entry point is not “replace an engineer with an agent” but “build the verification layer that lets any engineer test a hypothesis in under a minute.” That investment returns value whether or not agents are part of the workflow.
Teams exploring agentic automation for engineering workflows should note the shape of problems where the agent did well: numerical accuracy bugs, concurrency bottlenecks, and pattern-based kernel optimization. All three have objectively verifiable correctness criteria. The agent was not making judgment calls; it was testing hypotheses against verifiable signals. That is the category of systems work where agents are most effective — and it is narrower than “infrastructure engineering” in general.
For DevOps and platform teams thinking about AI-assisted operations: the aggregate metrics that dashboards expose are almost never sufficient to diagnose systems-layer problems. Building the instrumentation layer — execution traces, per-component microbenchmarks, correctness assertions — is prerequisite work regardless of whether an AI agent is reading those outputs or a human is.
Key Takeaways
- Z.ai’s GLM-5.3-powered Infra Agent built the production inference stack for GLM-5.3-Flash in exactly 13 days on 100,000+ Chinese accelerators, reaching 3.22x the W8A8 baseline — not an approximation, the published curve is day-by-day.
- The biggest gains came from parallelism (Layer Split + Context parallel: 1.41x to 2.49x in two days), not from the kernel optimization phase that dominates the technical narrative.
- T+3 regressed. Z.ai published this. The Hierarchical cache optimization dropped cumulative gain from 1.42x to 1.41x — systems optimization does not always go up.
- The GIL-related KV Transfer bottleneck causing 20% latency overhead was only discoverable through execution timeline traces, not through TTFT or throughput metrics.
- Dense feedback means each validation tool answers a specific question at a specific cost; the design separates correctness testing, microbenchmarks, execution traces, and end-to-end tests rather than relying on aggregate metrics as a proxy.
- Z.ai explicitly states they have not reached recursive self-improvement: humans owned objective-setting, constraint definition, and all production risk decisions.
Work With Origins AI
Origins AI builds production AI systems and agentic engineering workflows for engineering teams. If your team is working on inference optimization, AI-assisted infrastructure, or building the feedback systems that make agents useful in production, talk to our team.