In machine learning, calibration is used to better calculate confidence intervals and prediction probabilities of a given model. Calibration is particularly useful in areas like decision trees or random forests where certain classifiers only give the label of the event and don’t support native probabilities or confidence intervals. When modelers want to be confident in their predictions, they can evaluate their model via calibration to check that the predicted class distributions are similar to the current class distributions.
An example is illustrative. Say a music streaming app is using a churn model to predict which users will renew or not renew their membership each month. The binary churn classifier predicts that 95% of the users will still be users next month – so if the model is well calibrated, then around 95% of users will belong to the positive (no churn) class at the end of the month. If only 50% of users belong to the positive (no churn) class at the end of the month, the model may need a calibration layer.
What Are Calibration Curves?
Calibration curves, also known as reliability curves, plot the actuals/empirical probability against estimated/predicted probability. The calibration intercept, which is an assessment of calibration-in-the-large, has a target value of zero; values under the curve suggest overestimation, whereas values above the curve suggest underestimation.
How Are Reliability Diagrams Configured?
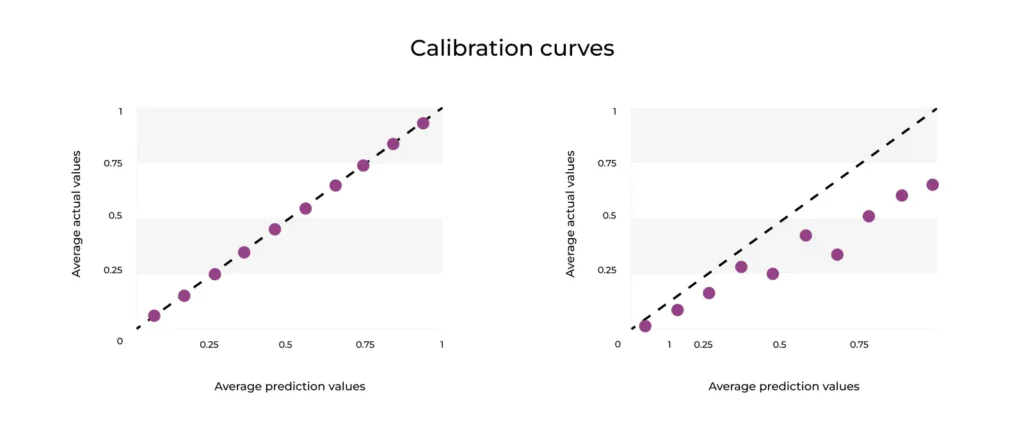
The reliablility curve in Figure 1 plots the average actuals against estimated probability , with the average prediction values on the x-axis and the average actual values on the y-axis. Average predictions over average actuals are used to determine how close the distribution of your predicted probability is to the distribution of your observed probability from your training data. Ultimately, this helps you see how well the probabilistic predictions of your classifier are calibrated for binned predictions.
For example, say you are predicting credit card fraud and produce the following prediction/actual pairs: (0.1, 0.1), (0.2, 0.1), (0.9, 0.7).
The calibration calculation is as follows:
calibration = avg prediction/avg actual = (0.1 + 0.2 + 0.9)/3 / (0.1 + 0.1 + 0.7) / 3 = 0.4 / 0.3 = 1.333
In this case, you are on average predicting higher (more fraud) than the ground truth.
How To Create a Reliability Curve
- Decide whether you want to use actual labels or scores to calculate the calibration. If you use actual labels, you can make True:1 when positive and False:0 when negative.
- Set the number of bins (or set explicit bins). For example, you might bin by prediction value into 10 bins (0-0.1, 0.1-0.2, … , 0.9-1.0).
- Find the average of the actual labels for each bin.
- Plot the average actual probability against average prediction probability in the corresponding bins.
Let’s return to the example of the music streaming application churn model predicting which users will renew or not renew their membership each month. Say the binary classifier predicts that 80% of the users will still be users next month. If the result at the end of the month is that ~40% of users belong to the positive (no churn) class, then we are overpredicting the probability that a user will not churn. This is also an example of a model that is poorly calibrated (at least for high probabilities), which is seen in Figure 1 on the right-hand plot. Additionally, if the model points are above the diagonal line, that means the model is under-calibrated.
Table 1: Table of predicted probabilities and actual percentages for a perfectly calibrated churn model
Bins Prediction values (x1, x2, x3, x4, x5) Actual values (y1, y2, y3, y4, y5) Average prediction values Average actual values
0.0 – 0.1 0.03, 0.07, 0.04, 0.06, 0.05 0.03, 0.07, 0.04, 0.06, 0.05 0.05 0.05
0.1 – 0.2 0.13, 0.17, 0.14, 0.16, 0.15 0.13, 0.17, 0.14, 0.16, 0.15 0.15 0.15
0.2 – 0.3 0.23, 0.27, 0.24, 0.26, 0.25 0.23, 0.27, 0.24, 0.26, 0.25 0.25 0.25
0.3 – 0.4 0.33, 0.37, 0.34, 0.36, 0.35 0.33, 0.37, 0.34, 0.36, 0.35 0.35 0.35
0.4 – 0.5 0.43, 0.47, 0.44, 0.46, 0.45 0.43, 0.47, 0.44, 0.46, 0.45 0.45 0.45
0.5 – 0.6 0.53, 0.57, 0.54, 0.56, 0.55 0.53, 0.57, 0.54, 0.56, 0.55 0.55 0.55
0.6 – 0.7 0.63, 0.67, 0.64, 0.66, 0.65 0.63, 0.67, 0.64, 0.66, 0.65 0.65 0.65
0.7 – 0.8 0.73, 0.77, 0.74, 0.76, 0.75 0.73, 0.77, 0.74, 0.76, 0.75 0.75 0.75
0.8 – 0.9 0.83, 0.87, 0.84, 0.86, 0.85 0.83, 0.87, 0.84, 0.86, 0.85 0.85 0.85
0.9 – 1.0 0.93, 0.97, 0.94, 0.96, 0.95 0.93, 0.97, 0.94, 0.96, 0.95 0.95 0.95
Table 2: Table of predicted probabilities and actual percentages for an overfit churn model
Bins Prediction values (x1, x2, x3, x4, x5) Actual values (y1, y2, y3, y4, y5) Average prediction values Average actual values
0.0 – 0.1 0.03, 0.07, 0.04, 0.06, 0.05 0.03, 0.07, 0.04, 0.06, 0.05 0.05 0.03
0.1 – 0.2 0.13, 0.17, 0.14, 0.16, 0.15 0.15, 0.12, 0.12, 0.09, 0.07 0.15 0.11
0.2 – 0.3 0.23, 0.27, 0.24, 0.26, 0.25 0.21, 0.23, 0.22, 0.11, 0.20 0.25 0.19
0.3 – 0.4 0.33, 0.37, 0.34, 0.36, 0.35 0.28, 0.24, 0.38, 0.23, 0.43 0.35 0.31
0.4 – 0.5 0.43, 0.47, 0.44, 0.46, 0.45 0.34, 0.17, 0.41, 0.27, 0.23 0.45 0.28
0.5 – 0.6 0.53, 0.57, 0.54, 0.56, 0.55 0.39, 0.47, 0.53, 0.41, 0.51 0.55 0.46
0.6 – 0.7 0.63, 0.67, 0.64, 0.66, 0.65 0.33, 0.28, 0.43, 0.49, 0.33 0.65 0.37
0.7 – 0.8 0.73, 0.77, 0.74, 0.76, 0.75 0.49, 0.62, 0.51, 0.55, 0.58 0.75 0.55
0.8 – 0.9 0.83, 0.87, 0.84, 0.86, 0.85 0.73, 0.62, 0.54, 0.71, 0.65 0.85 0.65
0.9 – 1.0 0.93, 0.97, 0.94, 0.96, 0.95 0.83, 0.68, 0.55, 0.81, 0.63 0.95 0.70
The better calibrated the model, the closer the plotted points will be to a diagonal line (increasing from left to right). As you can see from Figure 1 , the first plot shows that the model is perfectly calibrated with matching (x,y) points and a slope of 1.

As the right-hand plot in Figure 1 makes clear, this model barely follows that line of best fit. A calibration slope << 1 is indicative of overfitting a model to the test data and suggests that the predictions for users who won’t churn are too extreme. When we look at row 8 in Table 2, the bin (0.7 – 0.8) predicts that 75% of the users in that bin (i.e users predicted with ~75% certainty) who were subscribers last month will continue to subscribe to your streaming service next month; however, we see that only 55% of those users who were predicted to stay subscribed actually did and the rest churned. This shows how the model is overpredicting and overestimating the number of users who will not churn. This could lead to continually underpredicting user churn in the future, suggesting it might be best to calibrate your model.
How To Calibrate a Model In Production
Once you are monitoring the calibration of your model in production, you can decide to re-calibrate your model if the inferences start diverging from your training data. In order to do this, you will need to add a calibration layer in model development. This can be done in a few steps.
- Take your model offline and put in a challenger model.
- Split the data. Train / Test / Validation (80:10:10 split, for example).
- Choose your regressor (also called a calibrator) – either a sigmoid regressor, a non-parametric isotonic regressor, or a multi-class support option.
- Use the test data to fit your regressor so you won’t overfit on the distribution of your training dataset.
- Apply the classifier post-model training. You will input the old uncalibrated predictions and output better predictions.
- Put the newly calibrated model back into production and continue monitoring.
When Is a Calibration Curve Not Useful?
As discussed above, teams generally use calibration on classification models; if you have a regression model that already calibrated probabilities, then you may not need calibration. Also, calibration can appear biased depending on the model used. For example, a naive Bayes model assumes features are conditionally independent given the class and will squeeze the probabilities towards 0 and 1 (which is good for calibration metrics). Similarly, logistic regression will also squeeze the probabilities towards 0 and 1 because it minimizes log loss.
Also, it’s worth noting that for calibration plots to work you need enough data to take an average or else you would be plotting every single point. If you do not have enough data per bin, then your reliability curve will be biased for bins with few data points. These curves also “calibrate” for the fraction of positives. If you are trying to maximize negative events, minimize false positives, or minimize false negatives then other evaluation metrics would be better at assessing the viability of your model.

